The documentation you are viewing is for Dapr v1.8 which is an older version of Dapr. For up-to-date documentation, see the latest version.
Profiling & Debugging
In any real world scenario, an app might start exhibiting undesirable behavior in terms of resource spikes. CPU/Memory spikes are not uncommon in most cases.
Dapr allows users to start an on-demand profiling session using pprof through its profiling server endpoint and start an instrumentation session to discover problems and issues such as concurrency, performance, cpu and memory usage.
Enable profiling
Dapr allows you to enable profiling in both Kubernetes and stand-alone modes.
Stand-alone
To enable profiling in Standalone mode, pass the --enable-profiling and the --profile-port flags to the Dapr CLI:
Note that profile-port is not required, and if not provided Dapr will pick an available port.
dapr run --enable-profiling --profile-port 7777 python myapp.py
Kubernetes
To enable profiling in Kubernetes, simply add the dapr.io/enable-profiling annotation to your Dapr annotated pod:
   annotations:
    dapr.io/enabled: "true"
    dapr.io/app-id: "rust-app"
    dapr.io/enable-profiling: "true"
Debug a profiling session
After profiling is enabled, we can start a profiling session to investigate what’s going on with the Dapr runtime.
Stand-alone
For Standalone mode, locate the Dapr instance that you want to profile:
dapr list
APP ID           DAPR PORT     APP PORT  COMMAND      AGE  CREATED              PID
node-subscriber  3500          3000      node app.js  12s  2019-09-09 15:11.24  896
Grab the DAPR PORT, and if profiling has been enabled as described above, you can now start using pprof to profile Dapr.
Look at the Kubernetes examples above for some useful commands to profile Dapr.
More info on pprof can be found here.
Kubernetes
First, find the pod containing the Dapr runtime. If you don’t already know the the pod name, type kubectl get pods:
NAME                                        READY     STATUS    RESTARTS   AGE
divideapp-6dddf7dc74-6sq4l                  2/2       Running   0          2d23h
If profiling has been enabled successfully, the runtime logs should show the following:
time="2019-09-09T20:56:21Z" level=info msg="starting profiling server on port 7777"
In this case, we want to start a session with the Dapr runtime inside of pod divideapp-6dddf7dc74-6sq4l.
We can do so by connecting to the pod via port forwarding:
kubectl port-forward divideapp-6dddf7dc74-6sq4 7777:7777
Forwarding from 127.0.0.1:7777 -> 7777
Forwarding from [::1]:7777 -> 7777
Handling connection for 7777
Now that the connection has been established, we can use pprof to profile the Dapr runtime.
The following example will create a cpu.pprof file containing samples from a profile session that lasts 120 seconds:
curl "http://localhost:7777/debug/pprof/profile?seconds=120" > cpu.pprof
Analyze the file with pprof:
pprof cpu.pprof
You can also save the results in a visualized way inside a PDF:
go tool pprof --pdf your-binary-file http://localhost:7777/debug/pprof/profile?seconds=120 > profile.pdf
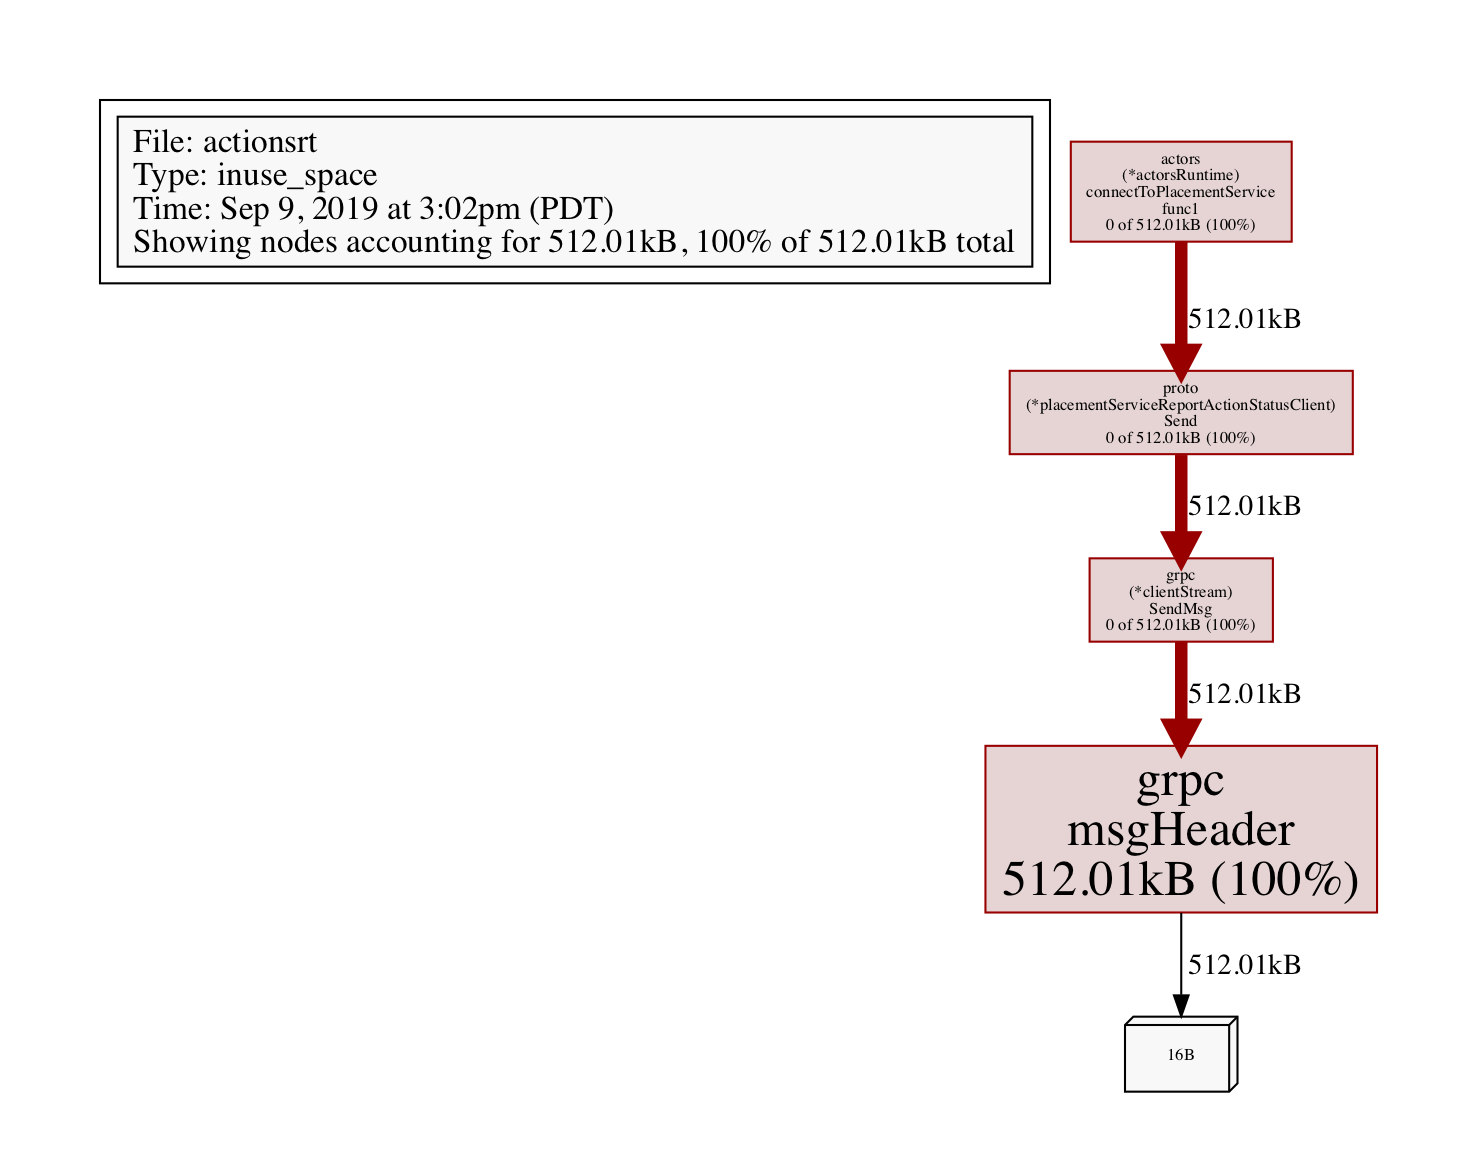
For memory related issues, you can profile the heap:
go tool pprof --pdf your-binary-file http://localhost:7777/debug/pprof/heap > heap.pdf
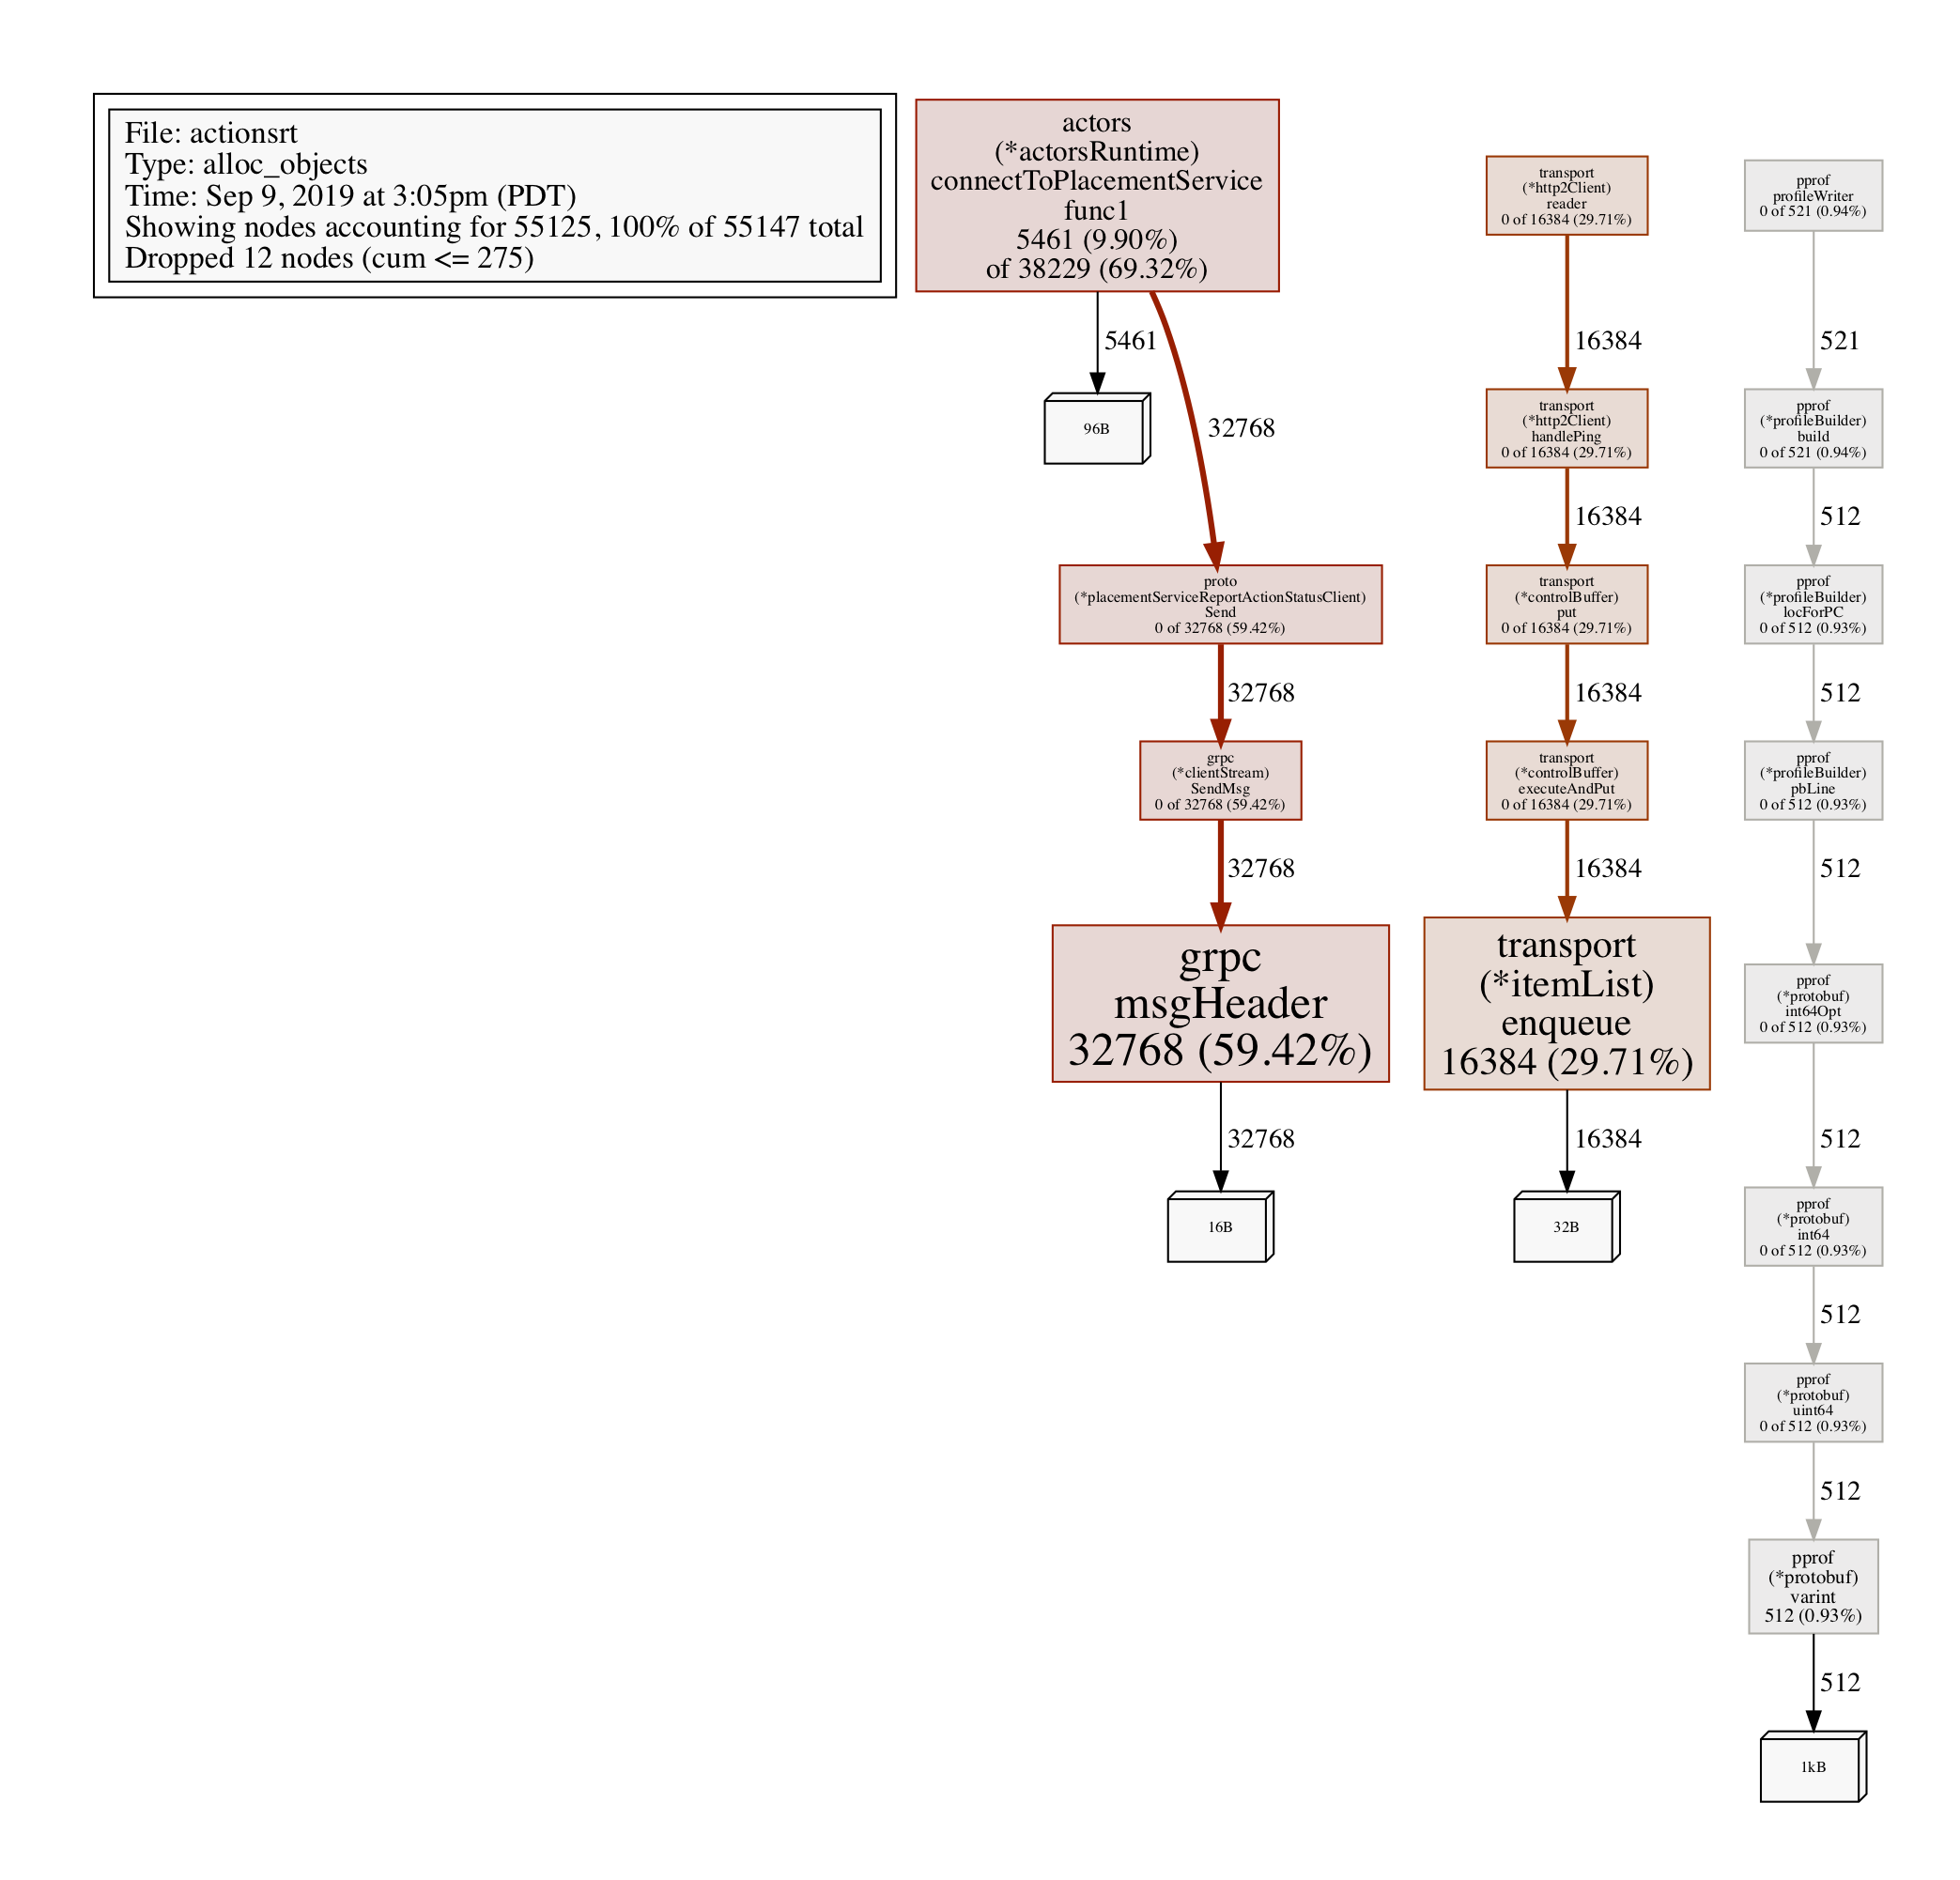
Profiling allocated objects:
go tool pprof http://localhost:7777/debug/pprof/heap
> exit

Saved profile in /Users/myusername/pprof/pprof.daprd.alloc_objects.alloc_space.inuse_objects.inuse_space.003.pb.gz
To analyze, grab the file path above (its a dynamic file path, so pay attention to note paste this one), and execute:
go tool pprof -alloc_objects --pdf /Users/myusername/pprof/pprof.daprd.alloc_objects.alloc_space.inuse_objects.inuse_space.003.pb.gz > alloc-objects.pdf
Feedback
Was this page helpful?
Glad to hear it! Please tell us how we can improve.
Sorry to hear that. Please tell us how we can improve.