The documentation you are viewing is for Dapr v1.8 which is an older version of Dapr. For up-to-date documentation, see the latest version.
Using OpenTelemetry Collector to collect traces
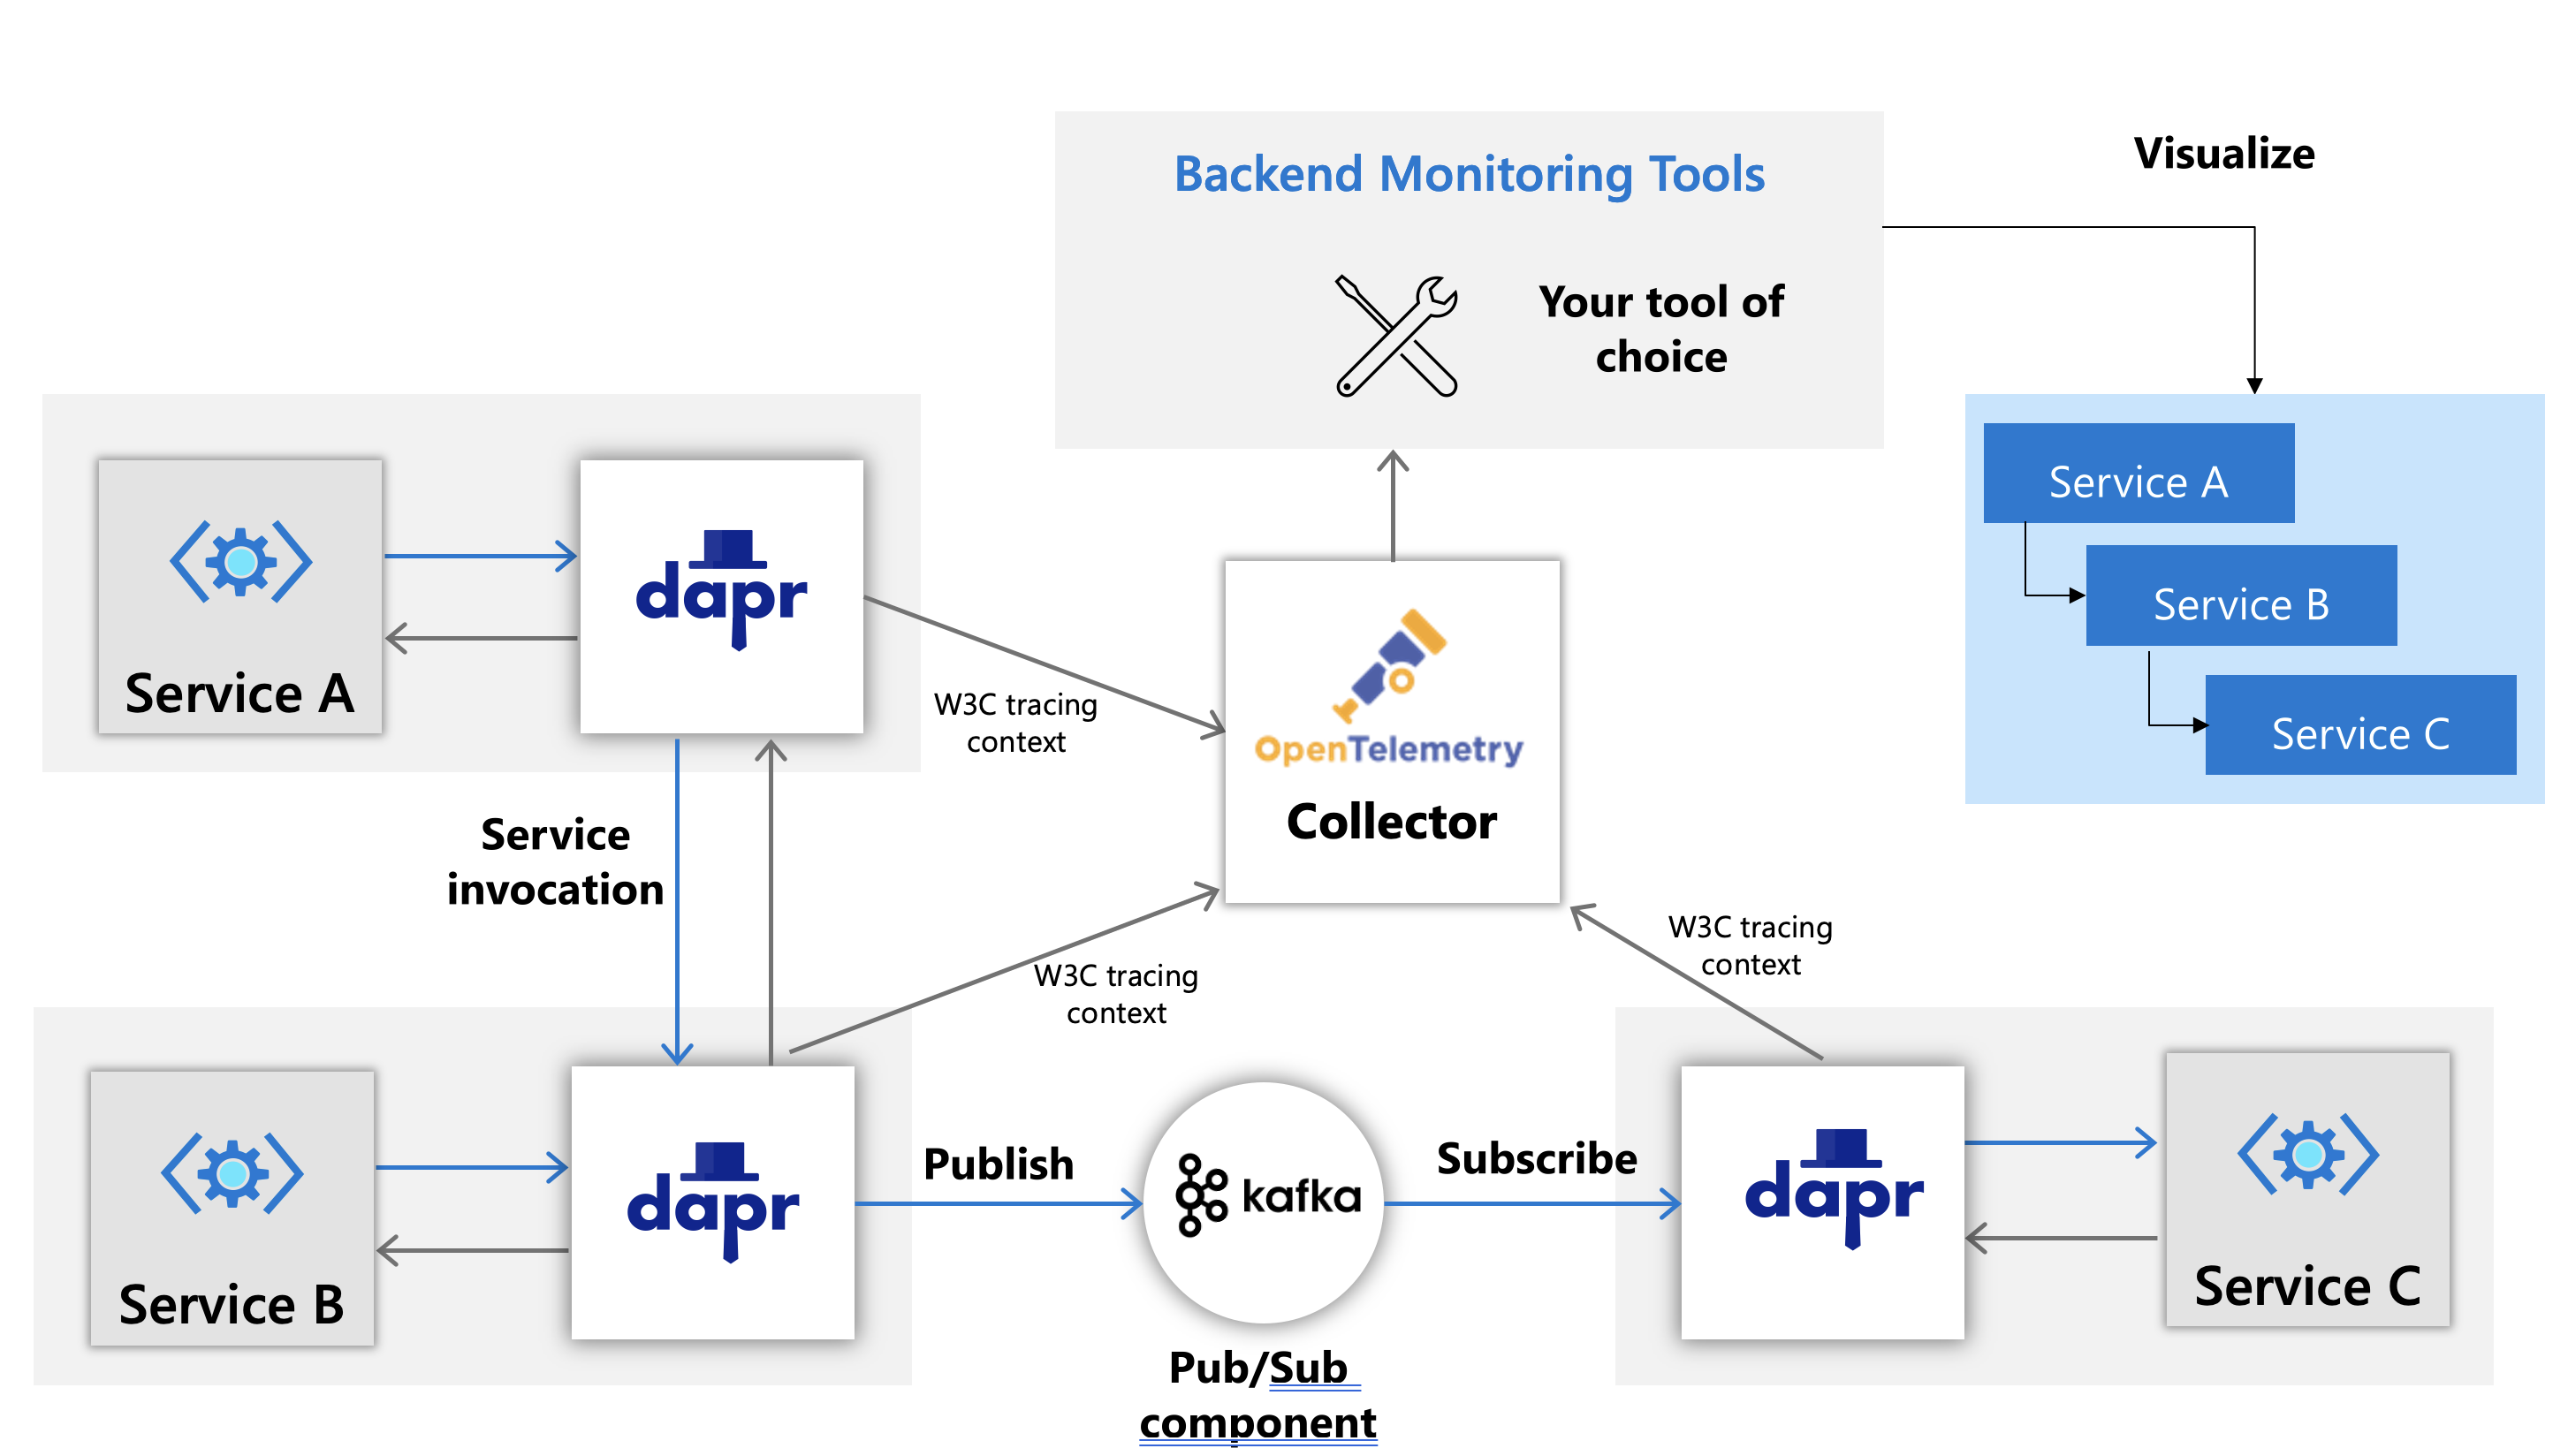
Dapr will be exporting trace in the OpenTelemetry format when OpenTelemetry is GA. In the mean time, traces can be exported using the Zipkin format. Combining with the OpenTelemetry Collector you can still send trace to many popular tracing backends (like Azure AppInsights, AWS X-Ray, StackDriver, etc).
Requirements
-
A installation of Dapr on Kubernetes.
-
You are already setting up your trace backends to receive traces.
-
Check OpenTelemetry Collector exporters here and here to see if your trace backend is supported by the OpenTelemetry Collector. On those linked pages, find the exporter you want to use and read its doc to find out the parameters required.
Setting OpenTelemetry Collector
Run OpenTelemetry Collector to push to your trace backend
-
Check out the file open-telemetry-collector-generic.yaml and replace the section marked with
<your-exporter-here>with the correct settings for your trace exporter. Again, refer to the OpenTelemetry Collector links in the Prerequisites section to determine the correct settings. -
Apply the configuration with
kubectl apply -f open-telemetry-collector-generic.yaml.
Set up Dapr to send trace to OpenTelemetry Collector
Turn on tracing in Dapr
Next, set up both a Dapr configuration file to turn on tracing and deploy a tracing exporter component that uses the OpenTelemetry Collector.
-
Create a collector-config.yaml file with this content
-
Apply the configuration with
kubectl apply -f collector-config.yaml.
Deploy your app with tracing
When running in Kubernetes mode, apply the appconfig configuration by adding a dapr.io/config annotation to the container that you want to participate in the distributed tracing, as shown in the following example:
apiVersion: apps/v1
kind: Deployment
metadata:
  ...
spec:
  ...
  template:
    metadata:
      ...
      annotations:
        dapr.io/enabled: "true"
        dapr.io/app-id: "MyApp"
        dapr.io/app-port: "8080"
        dapr.io/config: "appconfig"
Some of the quickstarts such as distributed calculator already configure these settings, so if you are using those no additional settings are needed.
That’s it! There’s no need include any SDKs or instrument your application code. Dapr automatically handles the distributed tracing for you.
NOTE: You can register multiple tracing exporters at the same time, and the tracing logs are forwarded to all registered exporters.
Deploy and run some applications. Wait for the trace to propagate to your tracing backend and view them there.
Related links
- Try out the observability quickstart
- How to set tracing configuration options
Feedback
Was this page helpful?
Glad to hear it! Please tell us how we can improve.
Sorry to hear that. Please tell us how we can improve.